Dashboard
The PiNetBeacon dashboard gives you a clean, friendly way to watch your network checks in real time: no log files, no scrolling, and no pretending you’re in a hacker movie.
If you’ve already run the monitoring script and started the dashboard server, this page will show you exactly what you’re looking at and how to make the most of it.
📝 Note:
The dashboard only updates whileserver.pyis running on your Raspberry Pi. If the page looks frozen in time, that’s usually why.
Dashboard Overview
Use this page when you want to see what PiNetBeacon is doing, instead of scanning terminal output like you’re decoding alien signals.
Think of it as PiNetBeacon’s “mission control”:
live status → recent checks → quick health info → all in one place.
Contents (choose your own adventure)
- 🎛 Understand what the dashboard shows
- 🚀 Start the dashboard server
- 🐛 Troubleshoot an empty dashboard
- 🔧 Next steps and ideas
🎛 What the dashboard shows
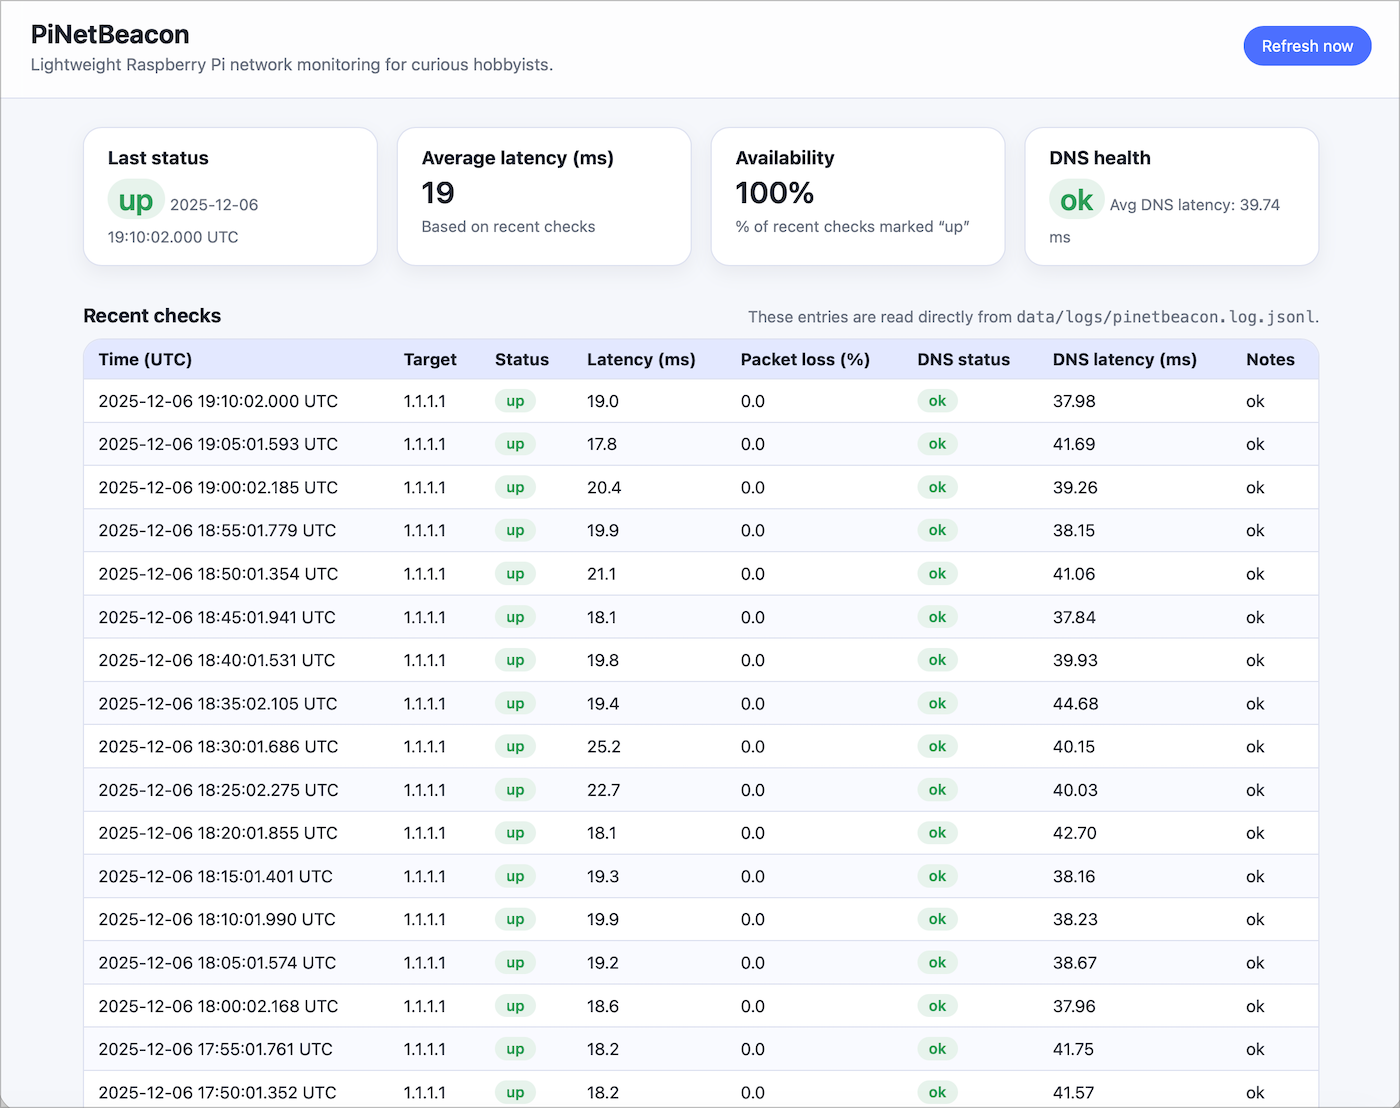
At a glance, the dashboard gives you:
- A status summary (up / down) based on recent checks
- The average latency of the last few pings
- Your overall availability, calculated from uptime
- A table of recent checks, updated in real time
- A small health block, which is basically a polite “is the server alive?” indicator
Think of it as PiNetBeacon’s home base: a live snapshot of how your network is behaving without needing to scroll through logs or stare at terminal output like you’re hacking the Pentagon.
If you’ve run the check script a few times and the dashboard is connected, you’ll see real data appear in all these places instead of placeholders.
Screenshot placeholder:
Status summary (top row)
These three cards update every time PiNetBeacon writes a new log entry:
Last status
Shows whether your network target is up or down, based on the most recent check.
You’ll see a badge like:
- 🟢 up → all good
- 🔴 down → something failed
- ⚪ unknown → no logs yet, or the dashboard is just waking up
Average latency
Shows the average latency (in milliseconds) across your recent checks.
If this number suddenly skyrockets, it’s usually because:
- your Wi-Fi is being dramatic
- your router is having an existential crisis
- or your ISP is flipping a coin somewhere upstream
Availability
Shows the percentage of recent checks marked up.
It’s a great quick “health score” for your connection.
Recent checks table
This is the raw data feed coming straight from your log file.
Each row shows:
- Timestamp
- Target host
- Status
- Latency (ms)
- Packet loss (%)
- Notes
If no logs exist yet, you’ll see a polite placeholder:
Waiting for data from /api/logs/latest...
(Imagine it standing there sipping coffee and checking its watch.)
Dashboard health block
At the bottom of the dashboard, there’s a little JSON readout that shows:
- whether the log file exists
- the path to the log
- how many entries were parsed
- any internal dashboard warnings
This is incredibly helpful when something looks “off” or you enjoy staring at JSON as a personality trait.
🚀 Starting the dashboard server
The dashboard is powered by a small Python web server that runs on your Raspberry Pi. Once it’s running, you can open the dashboard on any device on your network — your phone, your laptop, your toaster (okay, maybe not the toaster).
Let’s fire it up!
1. Go to the dashboard folder
On your Pi:
cd ~/PiNetBeacon/dashboard
Inside this folder you’ll find:
server.py→ the tiny web serverapp.js→ the dashboard logicstyles.css→ the dashboard’s glow-upindex.html→ the dashboard itself
2. Start the dashboard server
Run:
python3 server.py
You should see something like:
PiNetBeacon dashboard running on http://0.0.0.0:8080/
Serving logs from: /home/USERNAME/PiNetBeacon/data/logs/pinetbeacon.log.jsonl
Press Ctrl+C to stop.
If you see that?
🎉 Congratulations! The dashboard is alive 🙌
3. Open the dashboard in your browser
On any device on the same Wi-Fi network:
http://<your-pi-hostname>:8080/
For many people, this works:
http://pinetbeacon.local:8080/
or use its IP address:
http://192.168.x.x:8080/
💡 Tip:
If the dashboard loads but looks suspiciously empty, give it a moment as it only updates whileserver.pyis running.
4. Stop the server
Whenever you’re done watching the dashboard:
- Go to your Pi terminal
- Press Ctrl + C
This cleanly shuts down the dashboard server (no drama, no corruption, just good manners).
🐛 Troubleshooting the Dashboard
Sometimes the dashboard loads… and shows absolutely nothing. Don’t panic, this usually means something small isn’t running yet.
Here are the most common causes and how to fix each one.
1. server.py isn’t running
The dashboard only updates while the server is alive. Check if it’s running:
ps aux | grep server.py
If you don’t see it running, start it again:
cd ~/PiNetBeacon/dashboard
python3 server.py
2. The log file doesn’t exist yet
If PiNetBeacon hasn’t written any checks, the dashboard will be empty.
Confirm the log file exists:
ls -l ~/PiNetBeacon/data/logs/pinetbeacon.log.jsonl
If it’s missing, run a manual check:
cd ~/PiNetBeacon/scripts
python3 pinetbeacon_check.py
3. The log file does exist, but is empty
Open it to confirm:
tail ~/PiNetBeacon/data/logs/pinetbeacon.log.jsonl
If the file is empty:
- your internet may have been down when checks ran
- or the check script produced errors
- or entries may have been written somewhere unexpected
- or your Pi’s clock is wildly off (network timestamps break things)
4. Your Pi’s clock is wrong
PiNetBeacon relies on timestamps. If your Pi thinks it’s living in 1970, the dashboard gets confused.
Check time:
timedatectl
You should see something like:
System clock synchronized: yes
NTP service: active
If not:
sudo systemctl restart systemd-timesyncd
5. Your browser is caching old JS/HTML
Browsers sometimes cling to old versions of app.js like it’s sentimental.
Force a hard refresh:
- Mac: ⌘ + Shift + R
- Windows: Ctrl + Shift + R
- iOS Safari: Open → Close → Reopen tab
- Chrome: Right-click refresh → “Empty Cache and Hard Reload”
If all else fails, restart the server:
cd ~/PiNetBeacon/dashboard
python3 server.py
🔧 Next steps and ideas
If your dashboard is up and running, congratulations — you’ve officially given your Raspberry Pi a tiny job and it’s doing its best.
Here are some useful (and fun) things you can do next.
Make the dashboard start automatically
Right now you need to SSH in and run:
cd ~/PiNetBeacon/dashboard
python3 server.py
But you can create a systemd service so it launches on boot (aka: even when you forget). Full setup instructions are coming soon in the “Automation” docs.
Add more network targets
By default, PiNetBeacon pings 1.1.1.1, but you can track anything:
- your router
- your ISP’s gateway
google.com- your smart toaster (okay maybe not that)
We’ll cover multi-target monitoring in an upcoming guide.
📈 Add graphs and history
The dashboard is intentionally simple right now, but future versions may include:
- latency charts
- jitter tracking
- packet-loss visualizations
- sparklines (tiny graph that make you feel powerful)
🔒 Secure remote access (optional)
If you want to view the PiNetBeacon dashboard while you’re away from home, you’ll want a secure tunnel — not a terrifying port-forward blasted open to the internet.
Here are the two safest, beginner-friendly options:
Option 1: Tailscale (easiest + strongly recommended)
Tailscale creates a tiny, private VPN between your devices. Your dashboard becomes reachable anywhere, safely, without touching your router.
👉 Full guide:
Self-Hosting a VPN with Tailscale on a Raspberry Pi
If you want a “just works” solution, pick this one.
Option 2: Cloudflare Tunnel (also great)
Cloudflare Tunnel exposes your PiNetBeacon dashboard securely through Cloudflare’s network — no VPN needed, no ports opened.
👉 Cloudflare Tunnel setup guide:
(Coming soon!)
This is perfect if you prefer browser-based access or already use Cloudflare for your domains.
(Trying to port-forward port 8080 to the open internet is… let’s say adventurous. Please do not port-forward port 8080 to the internet. Your Pi deserves better than that life.)
🧪 Contribute ideas or improvements
PiNetBeacon is a small, friendly project. If you have ideas:
- open an issue
- submit a PR
- or just say hi in Discussions :)
Your Pi will thank you for the attention.